
01
Silent gaps
Reports stop for hours while the link stays up. We measure the longest gap against the cadence each device promised.
Coverage, measured. Not assumed.
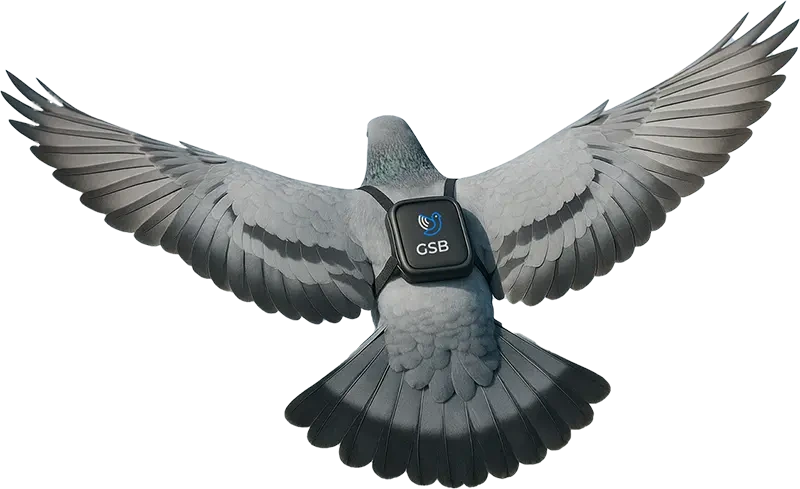
SignalWings measures what your IoT network actually delivers, report by report, and surveys the coverage nobody has mapped: on foot, by vehicle, and from the air with sensor-carrying pigeons.
The silent failure
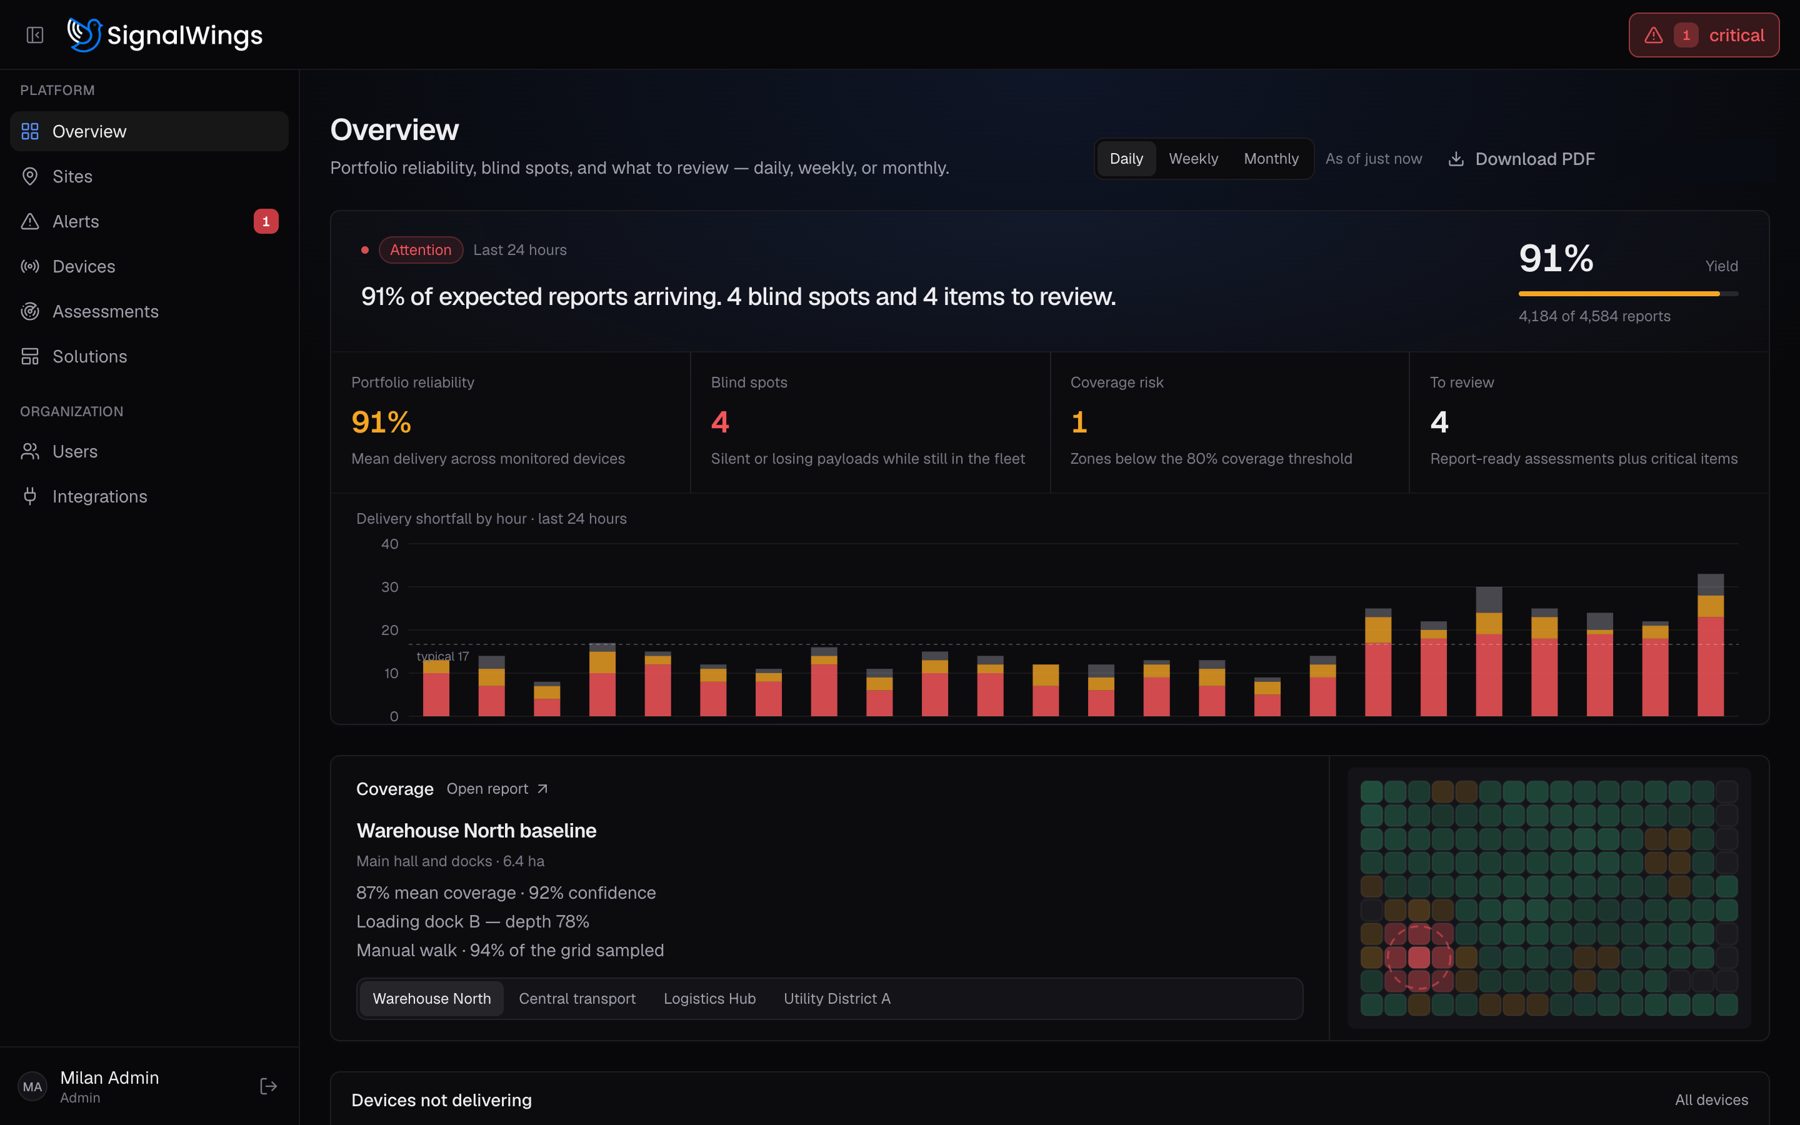
Status dashboards answer one question: can we reach the device? They never ask whether the readings it promised actually arrived. A sensor can show green all week and still lose a third of its data.
01
Reports stop for hours while the link stays up. We measure the longest gap against the cadence each device promised.
02
The device keeps sending the same number. Delivered, technically. Useless in practice, and invisible on a status page.
03
Values outside what the declared metric can physically be. That is a broken probe, not a heatwave.
04
Zones on the floor plan that no gateway actually hears. A device list can't show what was never installed.
The console
Every device carries an expected reporting interval and a declared metric. SignalWings scores what share of expected reports arrived, separately from link health, so “degraded” and “delivering” stop being confused.
Coverage surveys
A device list tells you what you installed. A survey tells you what actually works across the area. Every assessment ends with a heatmap, dead zones, a confidence level and findings marked measured or inferred.
Handheld receivers carried through the site. Best for warehouses, plants, basements and anything indoors.
Drive-through measurement for corridors, campuses, industrial parks and distributed meters.
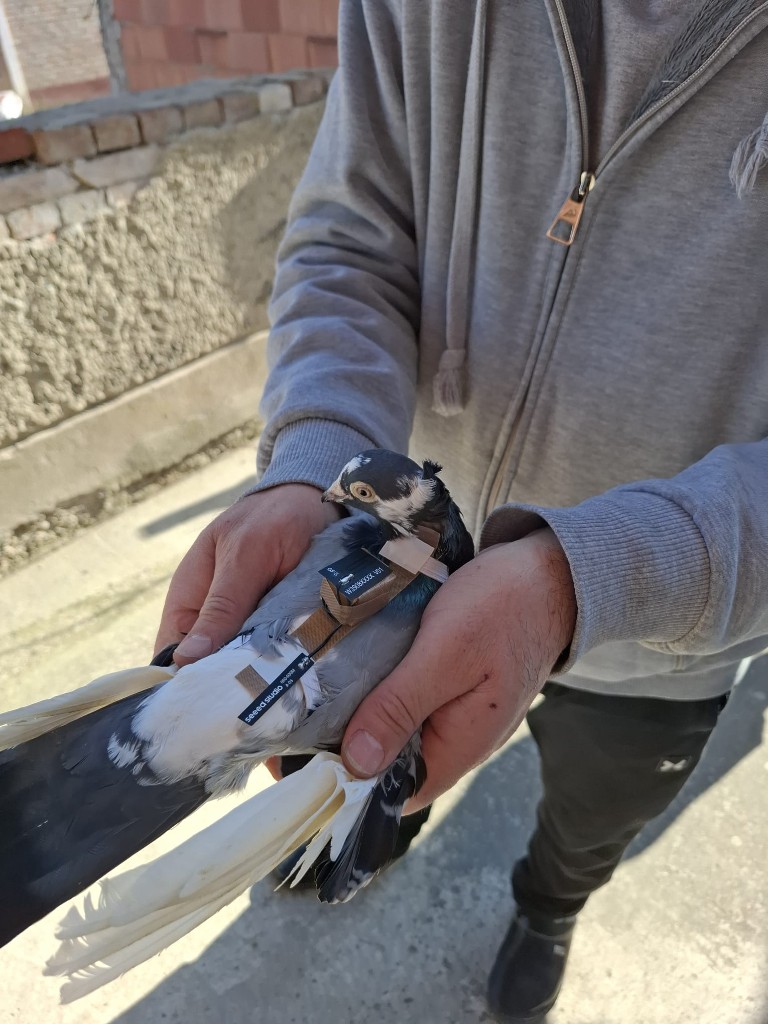
Sensor-carrying pigeons cover rooftops, courtyards and the space between buildings: the 3D layer street-level surveys miss.
Bio-IoT flight survey
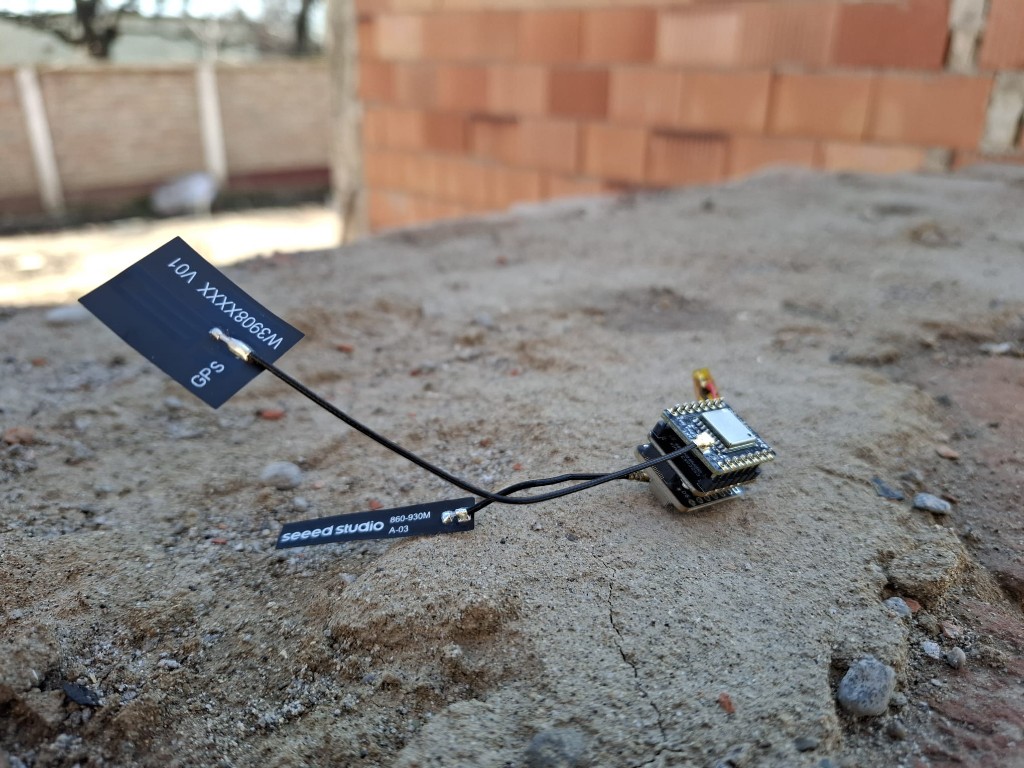
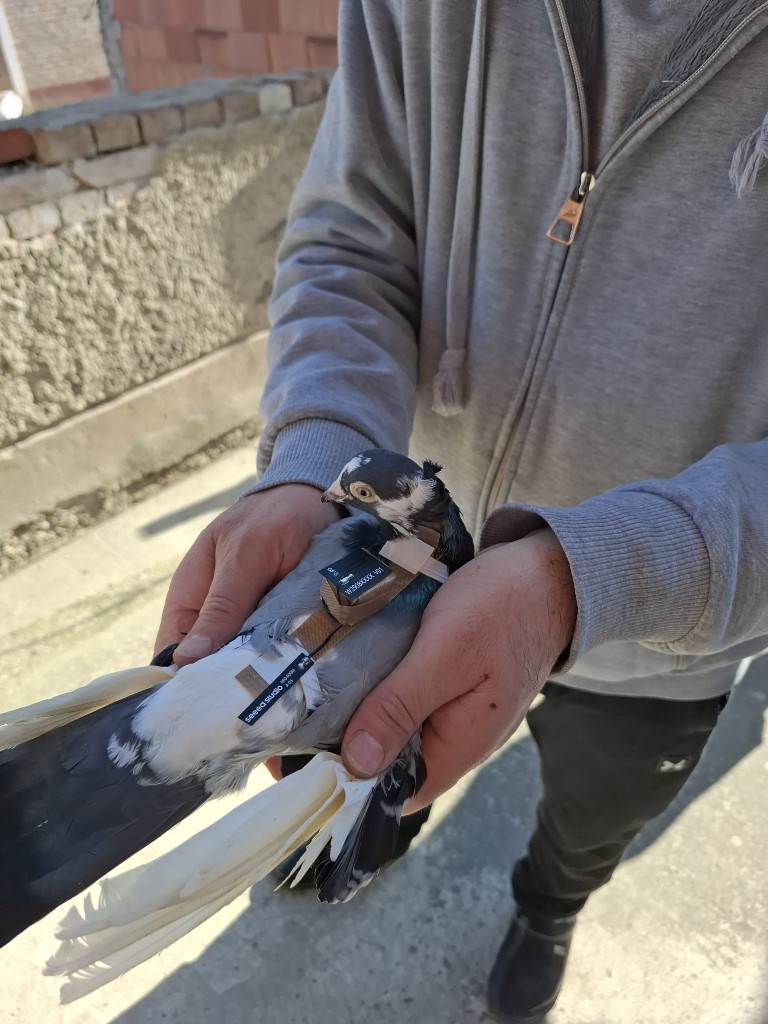
Racing pigeons already cross the rooftops, yards and gaps between buildings that walk and vehicle surveys can't reach. We fit them with a lightweight LoRa sensor and measure real signal in three dimensions.
How flight surveys work“If you want to cover an area quickly, you can simply fly — and what better way than with the animals that are already there?”
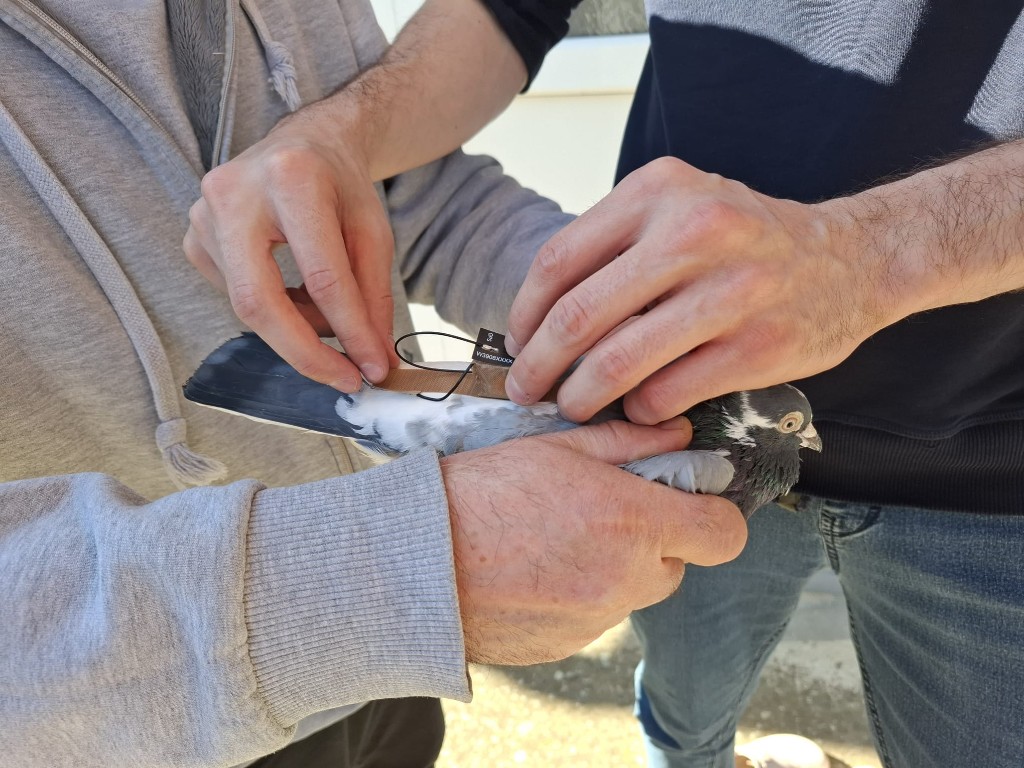
Welfare gate No check, no flight. Scheduling stays blocked until all five pass.
Where it pays off
Findings are written the way an operator would say them, and each one names the measurement behind it.
Forklifts, mobile equipment and operational zones. Find where assets disappear and which aisles no gateway hears.
Distributed sensors and gateways across plants and industrial parks, where a missed reading becomes a missed fault.
Validate radio coverage and gateway placement for meters and field sensors before and after rollout.
Mobility, environment and public systems in dense streets, where buildings bend and block the signal.
Pilot · 2 weeks
The pilot is built for a fast a-ha moment: a clear picture of what is active, missing, weak or quietly failing on one site, before you commit to anything bigger.
Day 1
We walk the site with your team, review what's installed and pick the zones that matter most.
Days 2–5
Sensors and gateways go in or get integrated. Walk, vehicle or flight survey runs across the area.
Days 6–13
Every device is scored against its expected cadence: gaps, frozen values, out-of-range readings.
Day 14
Coverage heatmap, dead zones, anomaly report and a ranked list of what to fix first.
Free · 2 minutes · no call
Eight questions about how you monitor today. You get a score across four areas, the blind spots it points to, and the Silent Failure Field Guide by email.
From the field
Photos from our first Bio-IoT field sessions and the lab: the sensors we build, the birds we work with and the handlers we work alongside.
Kurrant · April 2026 · Video interview
Nature as a Sensor: Rethinking Smart Cities & Utilities.

EIT Jumpstarter 2025
Grand Finalist, selected among top innovation teams from across Europe.
Read about the awards →The team
A small team from Belgrade making complex physical systems visible, measurable and actionable.

Strategy, partnerships & operations
Background in digital transformation and innovation projects with public and private partners.
LinkedIn
CTO · cybersecurity & IoT architecture
Designs and secures connected systems for industrial and urban environments.
LinkedIn
Product & user experience
Turns infrastructure data into dashboards, maps and decision-ready interfaces.
LinkedInTwo weeks, one site, one honest map. Or start with the free network check.