
Bio-IoT flight survey
Coverage, measured from the air.
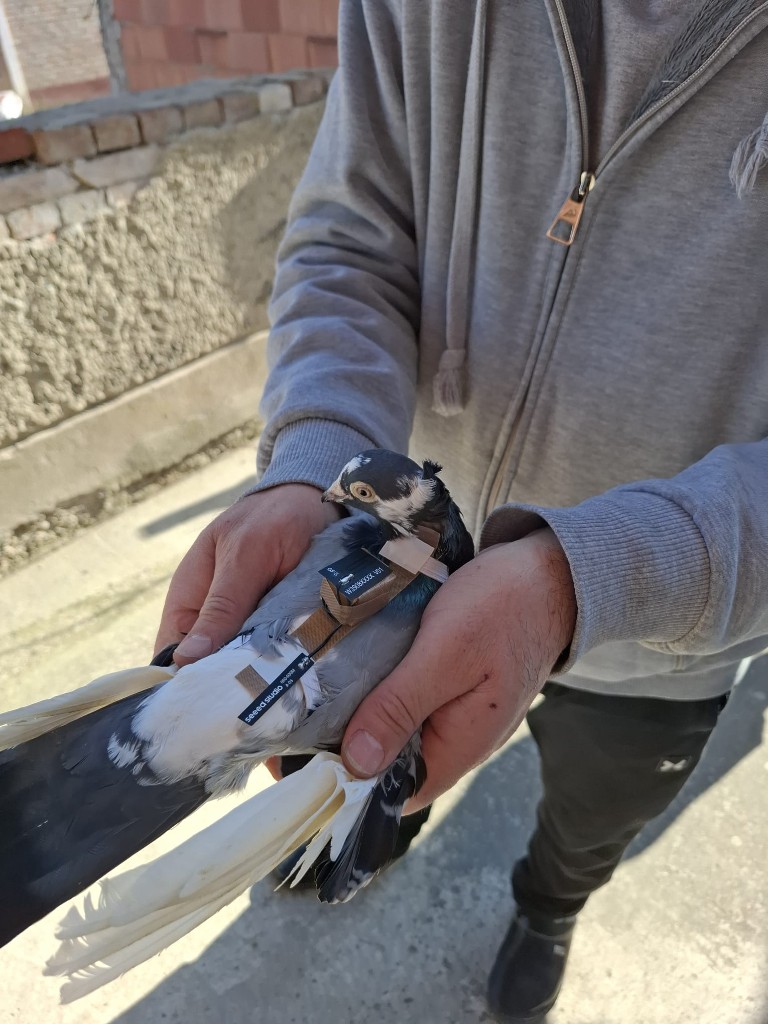
Sensor-carrying pigeons measure IoT signal over rooftops, through courtyards and between buildings: the layer ground surveys can't reach.
Why fly
Every survey method has a ceiling. Ours is the sky.
Walk and vehicle surveys measure where people can go. Most urban dead zones sit where they can't: at height, behind blocks, inside closed courtyards.
Most surveys combine methods. We recommend the mix after the area check.
How a flight survey runs
Five steps, one gate nobody skips.
- 01
Area and permit check
We map the area, release points and the permits it needs. Areas that can't be flown safely get a walk or vehicle survey instead.
- 02
Welfare gate
Five checks per run. Scheduling in the console stays blocked until every one passes.
- Payload weightSensor and harness checked as a share of each bird's body weight before it flies.
- Veterinary sign-offA vet clears every carrier for every run.
- Weather clearanceWind, rain and visibility inside safe limits for the whole flight window.
- Temperature limitsNo flights in heat or cold outside the agreed range.
- Permit on recordEach run references its permit before it can be scheduled.
- 03
Release and flight
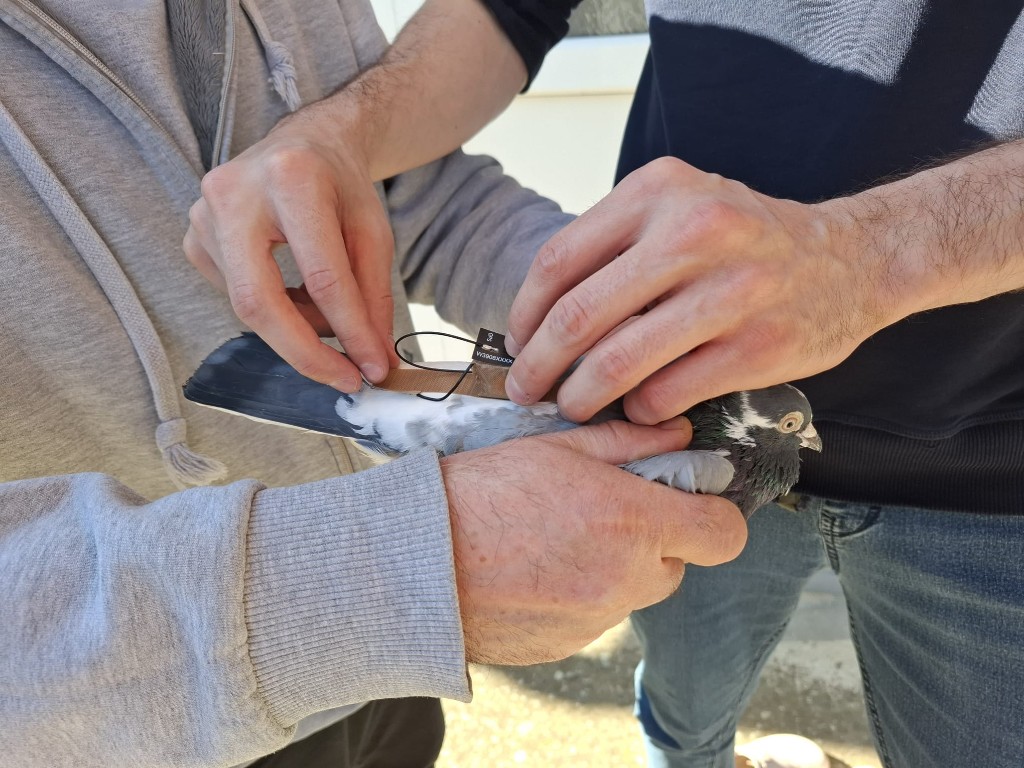
Handlers from partner lofts release the birds. Each sensor logs signal samples along its flight track.
- 04
Recovery and processing
Birds return to the loft, harnesses come off, and samples are processed into a coverage grid.
- 05
Report
Heatmap, dead zones, confidence and findings marked measured or inferred, in the console and as a PDF.
In the console
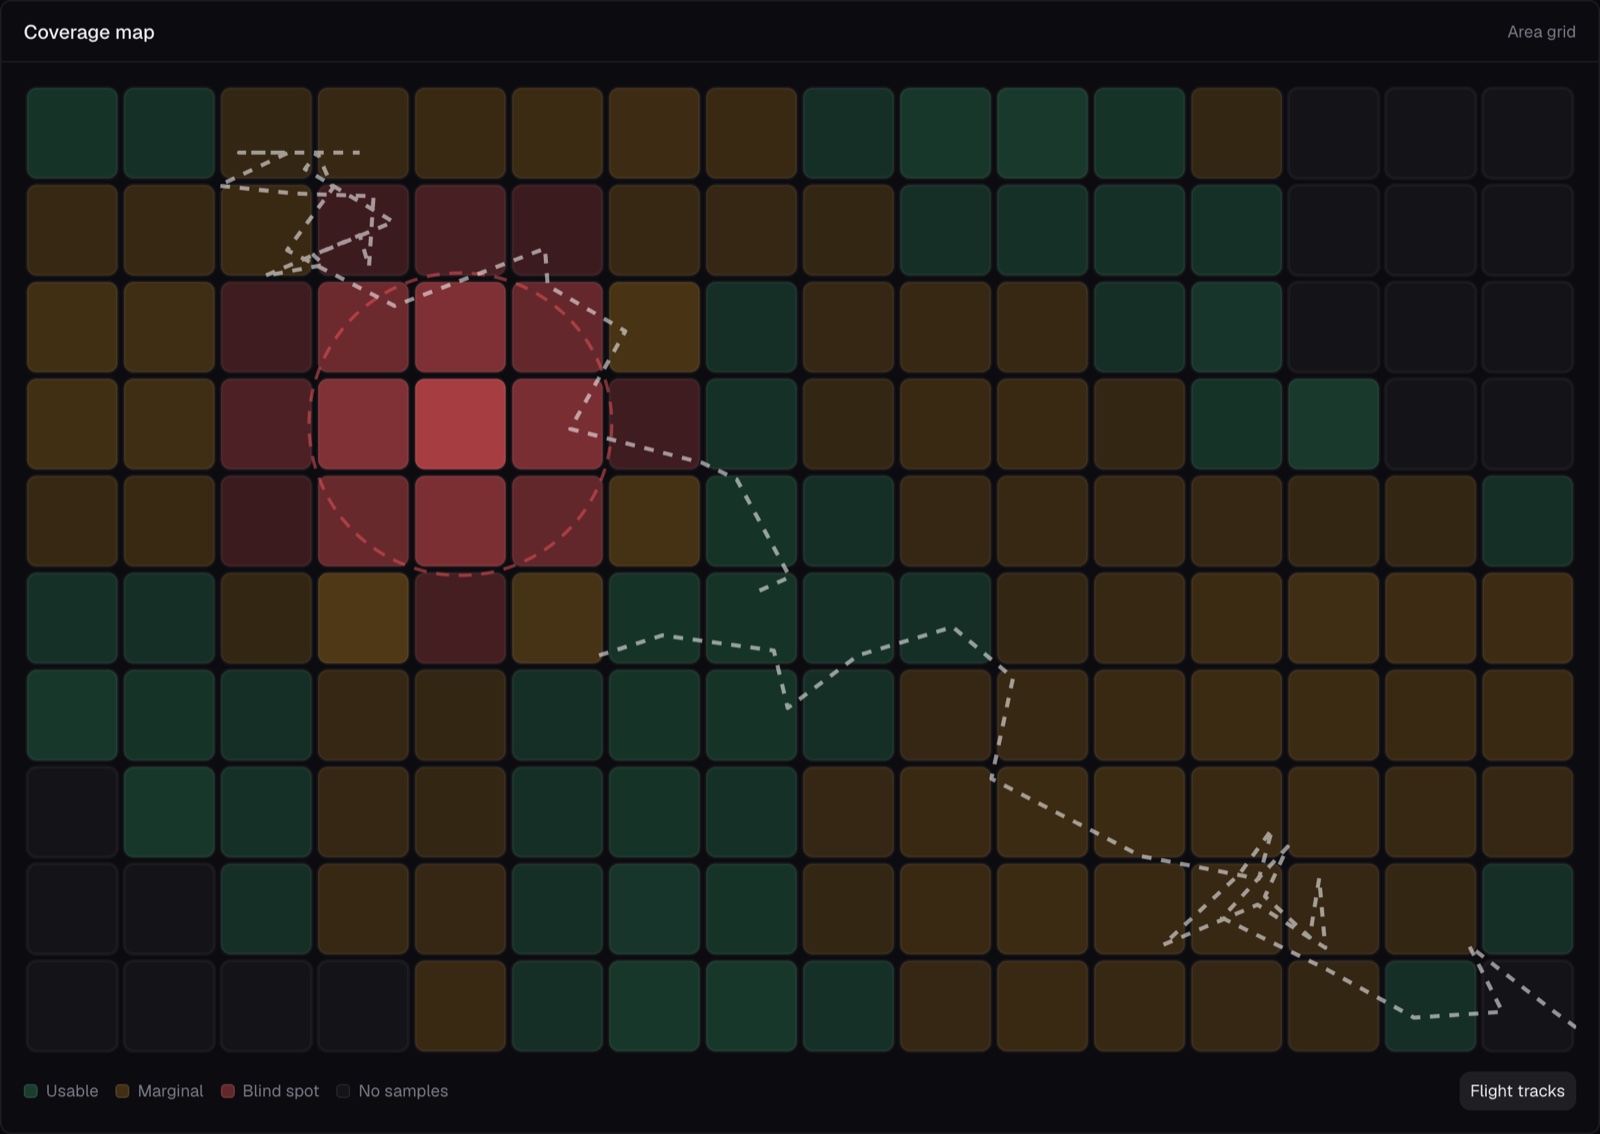
Every track, every sample, on one map.
Flight tracks are drawn over the coverage grid, so you see exactly where each measurement came from and where the birds didn't fly. Gaps in the tracks are reported as gaps, not guessed.
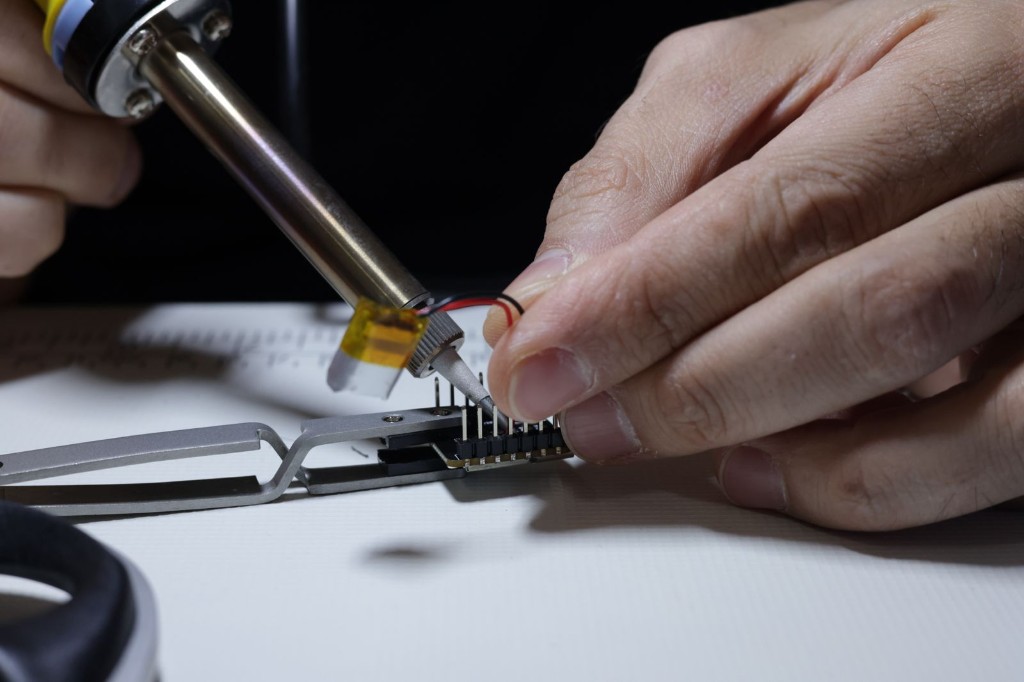
Built in our lab
Hardware made for a bird, not a drone.
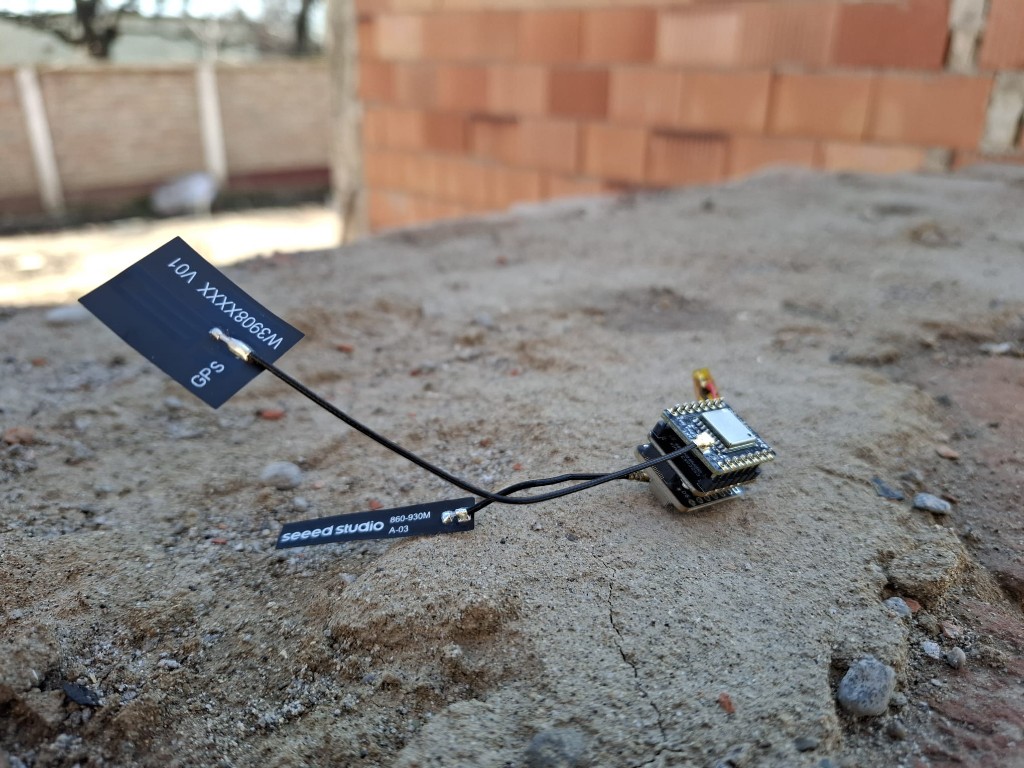
The sensor module, antennas and harness are assembled and tested in-house, designed to be light, non-invasive and removable after every flight.
From the field
Real birds, real boards, real sessions.
Photos from our first Bio-IoT field sessions and the lab: the sensors we build, the birds we work with and the handlers we work alongside.
Request a flight survey
Have an area nobody has mapped?
We'll check it against permits, weather windows and the 5-point welfare gate, and tell you honestly whether it can be flown.